# Explicit iterations
n = 3200
g = 100

g = (g+n/g)/2    # Apply the algorithm 3 times
g = (g+n/g)/2
g = (g+n/g)/2
print(g)56.57250910374256In Section 2.3 we saw how a variable can be repeatedly overwritten. Now that we have loops we can write this process more elegantly. Recall the algorithm for approximating the square root of a number. Given a number \(n\) that we want to find the square root of, we start with a first guess \(g_0\). We then iterally improve our guess with: \[g_{i+1} = \frac{g_i + \frac{n}{g_i}}{2}\] One way to approximate \(\sqrt{3200}\) with an initial guess of \(g_0 = 100\) is:
# Explicit iterations
n = 3200
g = 100
g = (g+n/g)/2 # Apply the algorithm 3 times
g = (g+n/g)/2
g = (g+n/g)/2
print(g)56.57250910374256We can achieve the same behavior with
# Explicit iterations with loop
n = 3200
g = 100

for i in range(3):
    g = (g+n/g)/2
print(g)56.57250910374256Is that the correct square root? No. Is it a good approximation? I don’t know.
Instead of iterating the algorithm a fixed number of times, we can iterate until some threshold of accuracy is reached. Roughly speaking, if you iterate the algorithm and get the same guess back, you have converged. If you run the algorithm and get nearly the same guess back, then you have nearly converged. Our threshold value will be the value \(\epsilon\) where we call our approximation “close enough” if: \[ |x_{i+1} - x_{i}| \leq \epsilon \]
# Threshold approach
n = 3200
g = 100

while abs((g + n/g)/2 - g) > 0.001:
    g = (g + n/g) / 2

print(g)56.56854263398415In both loop approaches, there is some parameter that can be modified to run the algorithm fewer or more times.
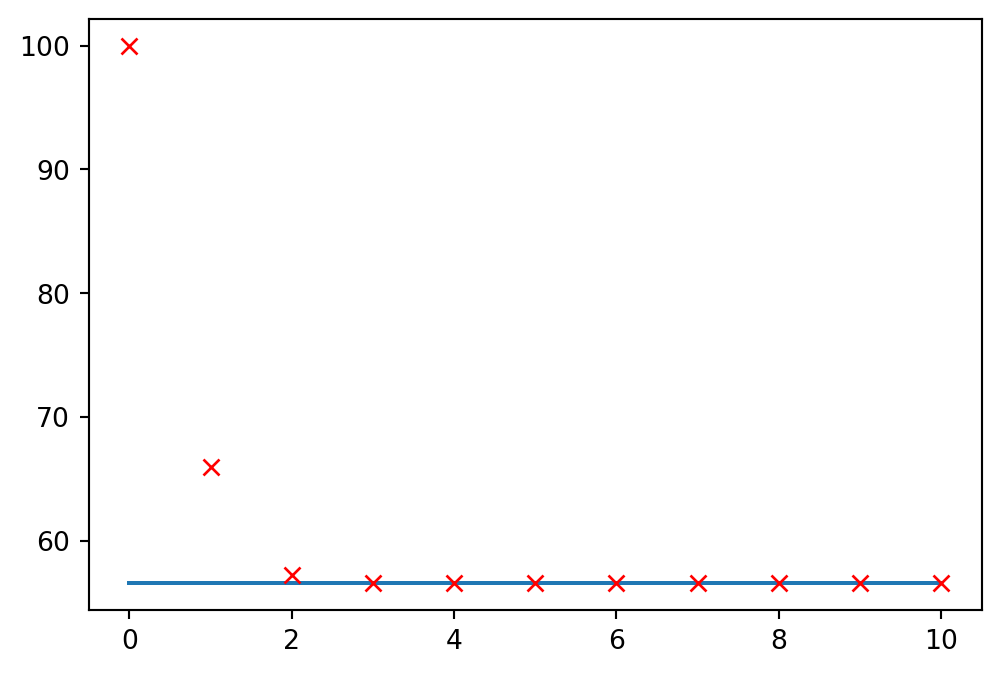
It is worthwhile to visualize our algorithm’s progress. This particular algorithm converges toward the correct answer quickly (quadratically), even if our initial guess is bad.
import matplotlib.pyplot as plt
import numpy as np

S = 3200  # Number to find sqrt of
x = 100   # Initial bad guess

plt.figure()

# Plot the "true" square root for reference
plt.plot([0,10],[np.sqrt(S),np.sqrt(S)])
plt.plot(0,x, 'rx')

for iteration in range(10):
    x = 0.5 * (x + S/x)
    plt.plot(iteration+1, x, 'rx')  # Plot each updated approximation

plt.show()